Started Updated
GitArt
Draw words and pixel art on your GitHub contribution graph.
- HTML
- CSS
- JavaScript
- Git
- Cloudflare Pages
It started with my own graph
Git lets you set the date of a commit to whatever you want. Once I knew that, I couldn’t resist. I made a repository, wrote a pile of backdated commits by hand, and drew emojis and text on my own GitHub contribution graph.
A few friends saw it and asked me how I did it. I told them the trick: change the git commit dates. The next question was always the same: “okay, but how do I make it draw that?”
Explaining how to work out which date lands on which square, one commit at a time, is not fun. So I built a website for it, something I could just send them.
Keeping it simple
I wanted GitArt to be simple, so I kept it to plain HTML, CSS and JavaScript. There’s no framework and no build step, and it’s hosted as static files on Cloudflare Pages.
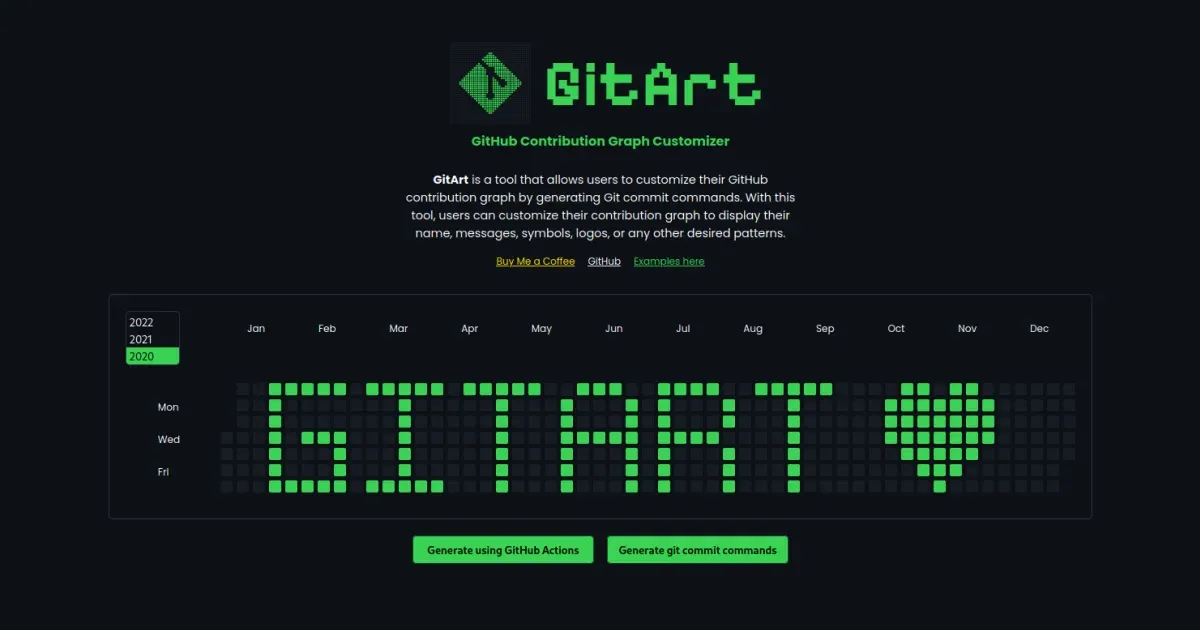
The first version did one thing:
- Pick a year.
- Left click a day on the graph to turn it green, and keep clicking to make it darker. Right click makes it lighter again.
- Press Generate and get the git commands.
The cover at the top of this page is that first version, with GitArt and a heart drawn on the graph.
How it works
Every square on the contribution graph is a day, and its shade is how many commits you made that day. So GitArt turns every square you paint into that many empty commits on that date:
git commit --allow-empty --date="Jan 5, 2020" --allow-empty-message -m ""You create a new repository, paste the commands (or download them as a shell script), and push. GitHub counts the commits and your drawing shows up on your profile.
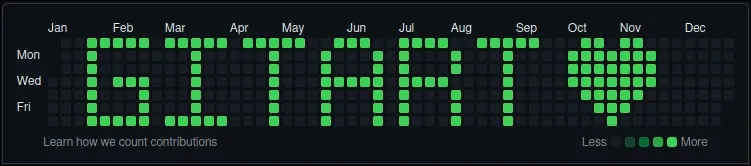
It works best on a year before you joined GitHub, where the graph is empty, so GitArt can look up your join date for you.
A detour through GitHub Actions
In May 2024 I tried to make it a one-click thing. A small Express API (gitart-api) took your details and started a GitHub Actions workflow. The workflow created the repository, ran the commits and pushed them for you.
It worked, but you had to hand a GitHub token to a form, and the copy-paste route was simpler anyway. I hid it in 2025 and removed it completely in 2026. GitArt is back to generating commands you run yourself.
Typing words onto the graph
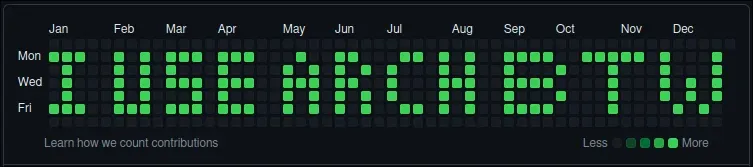
Clicking squares one by one is fine for a small emoji, but slow for a word. In September 2026 I came back to GitArt and added a text box. Type a word and it’s drawn on the graph with a tiny 3×5 pixel font. You can then fix any square by hand.
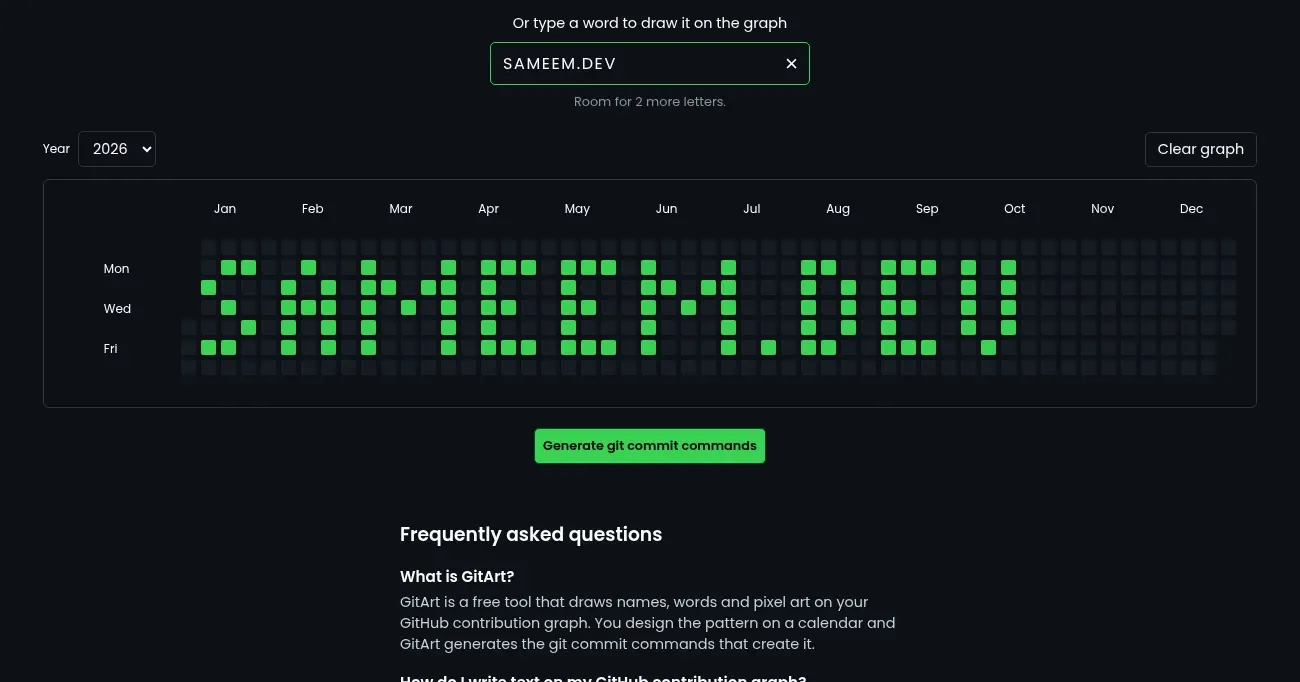
The graph has room for about a dozen letters, so the page tells you how many you have left, and your text stays put when you switch years.
The same update also:
- Fixed dates landing one day off for people outside positive UTC time zones.
- Made the squares and buttons keyboard accessible.
- Moved the examples to their own page.
- Split the one big script into small ES modules, still with no build step.
Timeline
- Apr 2024: first version, with the clickable graph, year picker and generated commands.
- May 2024: GitHub Actions API, and moved to
gitart.pages.dev. - Jun 2024: download the commands as a shell script.
- Sep 2026: text input, bug fixes, accessibility and a code cleanup.